Google Analytics is a tracking tool that all school marketers should be utilizing to help measure the performance of their school website and the Digistorm School App. Not only does it provide insight into your website’s traffic, but it’s also free to use! If this is your first time using Google Analytics, it may be hard to understand how it works and why you need this information. This blog will break down the importance of Google Analytics and the best practices for analyzing, measuring, and monitoring data sets and reports.
Setting yourself up for Google Analytics success
So you may be thinking, how does setting up tracking on Google Analytics actually work? From an outside perspective, it may seem like a combination of complex processes, but from a marketing side of view, it’s as simple as creating an account and adding a tracking code to your school website. Once you’ve set up your Google Analytics account you need to create a “property” for each website that you want to receive data – this is so that Google Analytics can start collecting data on user behavior. Creating a property for your website will then generate a Google Analytics ID which you can access by clicking the “property column” under Admin. Within the property column, you will see Tracking info > Tracking Code. The next step is to copy and paste the tracking code snippet into a global site tag, which is a Javascript tagging framework. For detailed instructions on how to add your tracking ID to the code, check out the Google Analytics further breakdown.
Accessing and interpreting the right reports
Once you’re all set up, it’s time to start accessing the user behavior data for your website. Your school website acts as a central hub for your different digital marketing tactics. If you are utilizing email marketing, social media posts, or a school blog it’s likely that you are redirecting users back to your website within these posts. Having an understanding of your Google Analytics data will allow you to interpret the strengths and weaknesses of your website so you can then optimize your website’s performance and achieve results.
You can start accessing your data by creating your own custom reports and metrics or utilizing Google’s pre-made reports. For school marketers, we believe the three most important data reports in Google analytics are: Audience, Acquisition, and Behavior. You can access these three reports on the left-hand side when you log into your Google Analytics Home page. Before analyzing these reports make sure that you’re choosing the correct date range as Google Analytics does not automatically choose this for you.
Audience
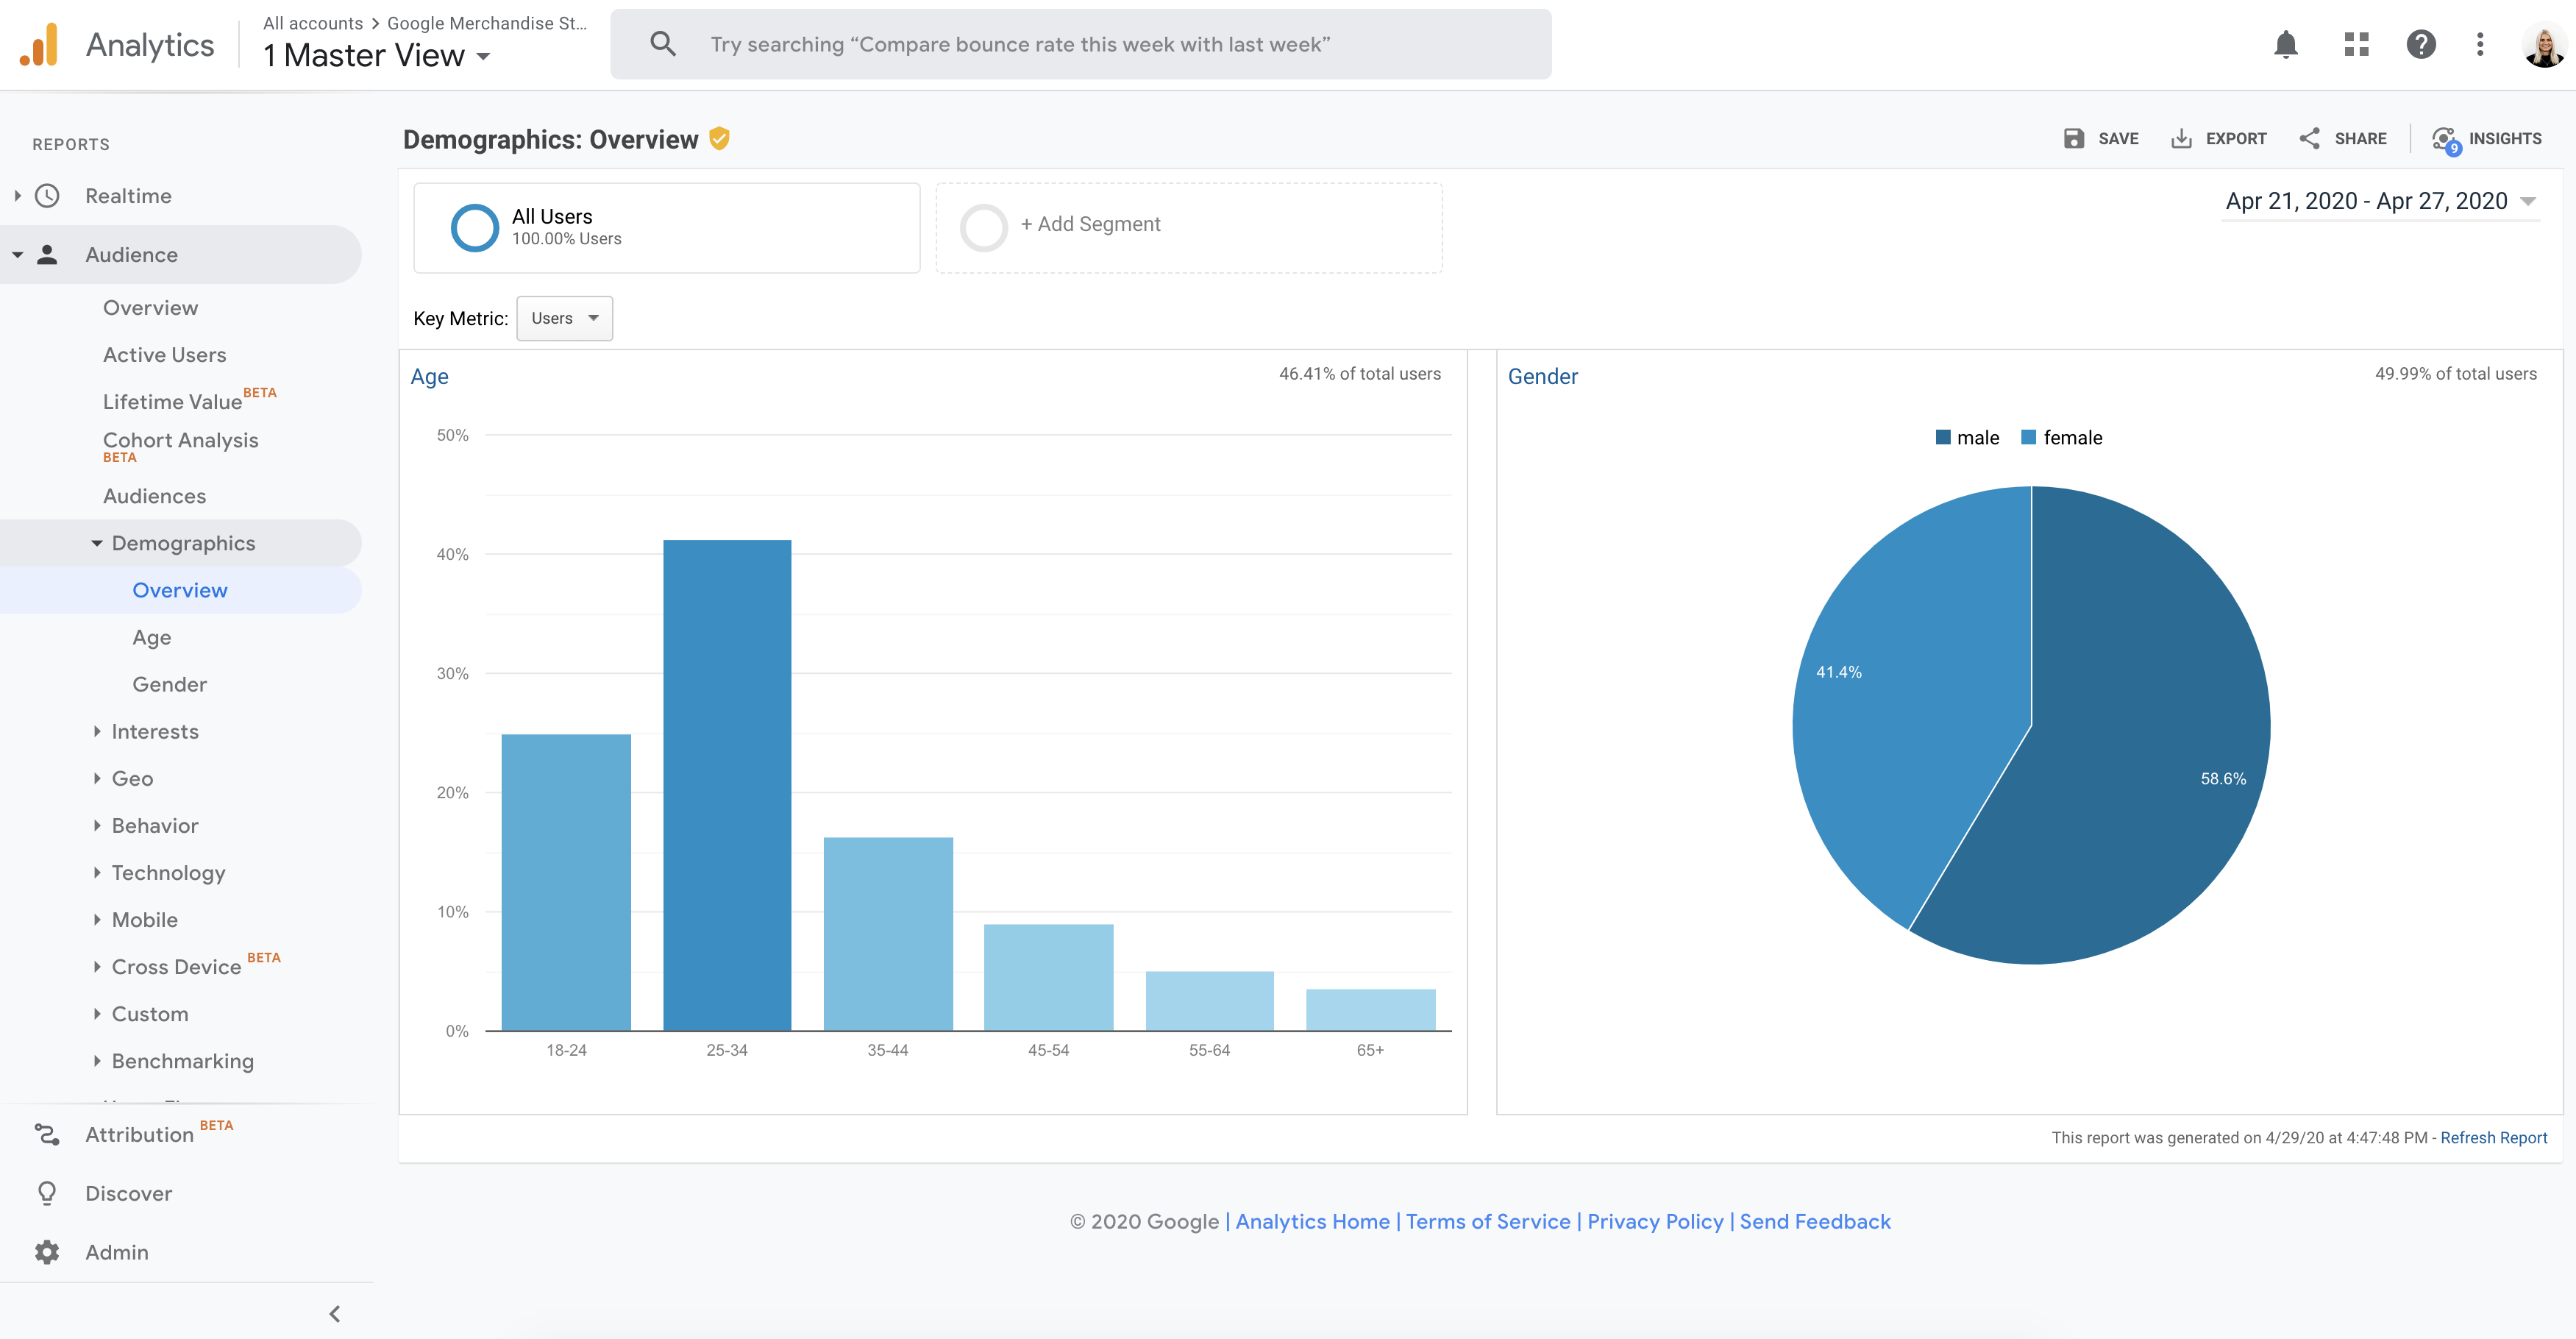
The Audience report gives you a general overview of your current audience. It provides a breakdown of the number of active users, the website bounce rate, individual sessions, device usage, and demographic details like age and gender. It’s helpful to receive user demographic information as it will help you group your target audiences and potential personas for prospective families and students. You should also be aware of the device usage data to show whether users are mainly using a mobile, tablet, or desktop so that you can make sure your website is responsive across all devices.


Source: Google Analytics for the Google Merchandise Store
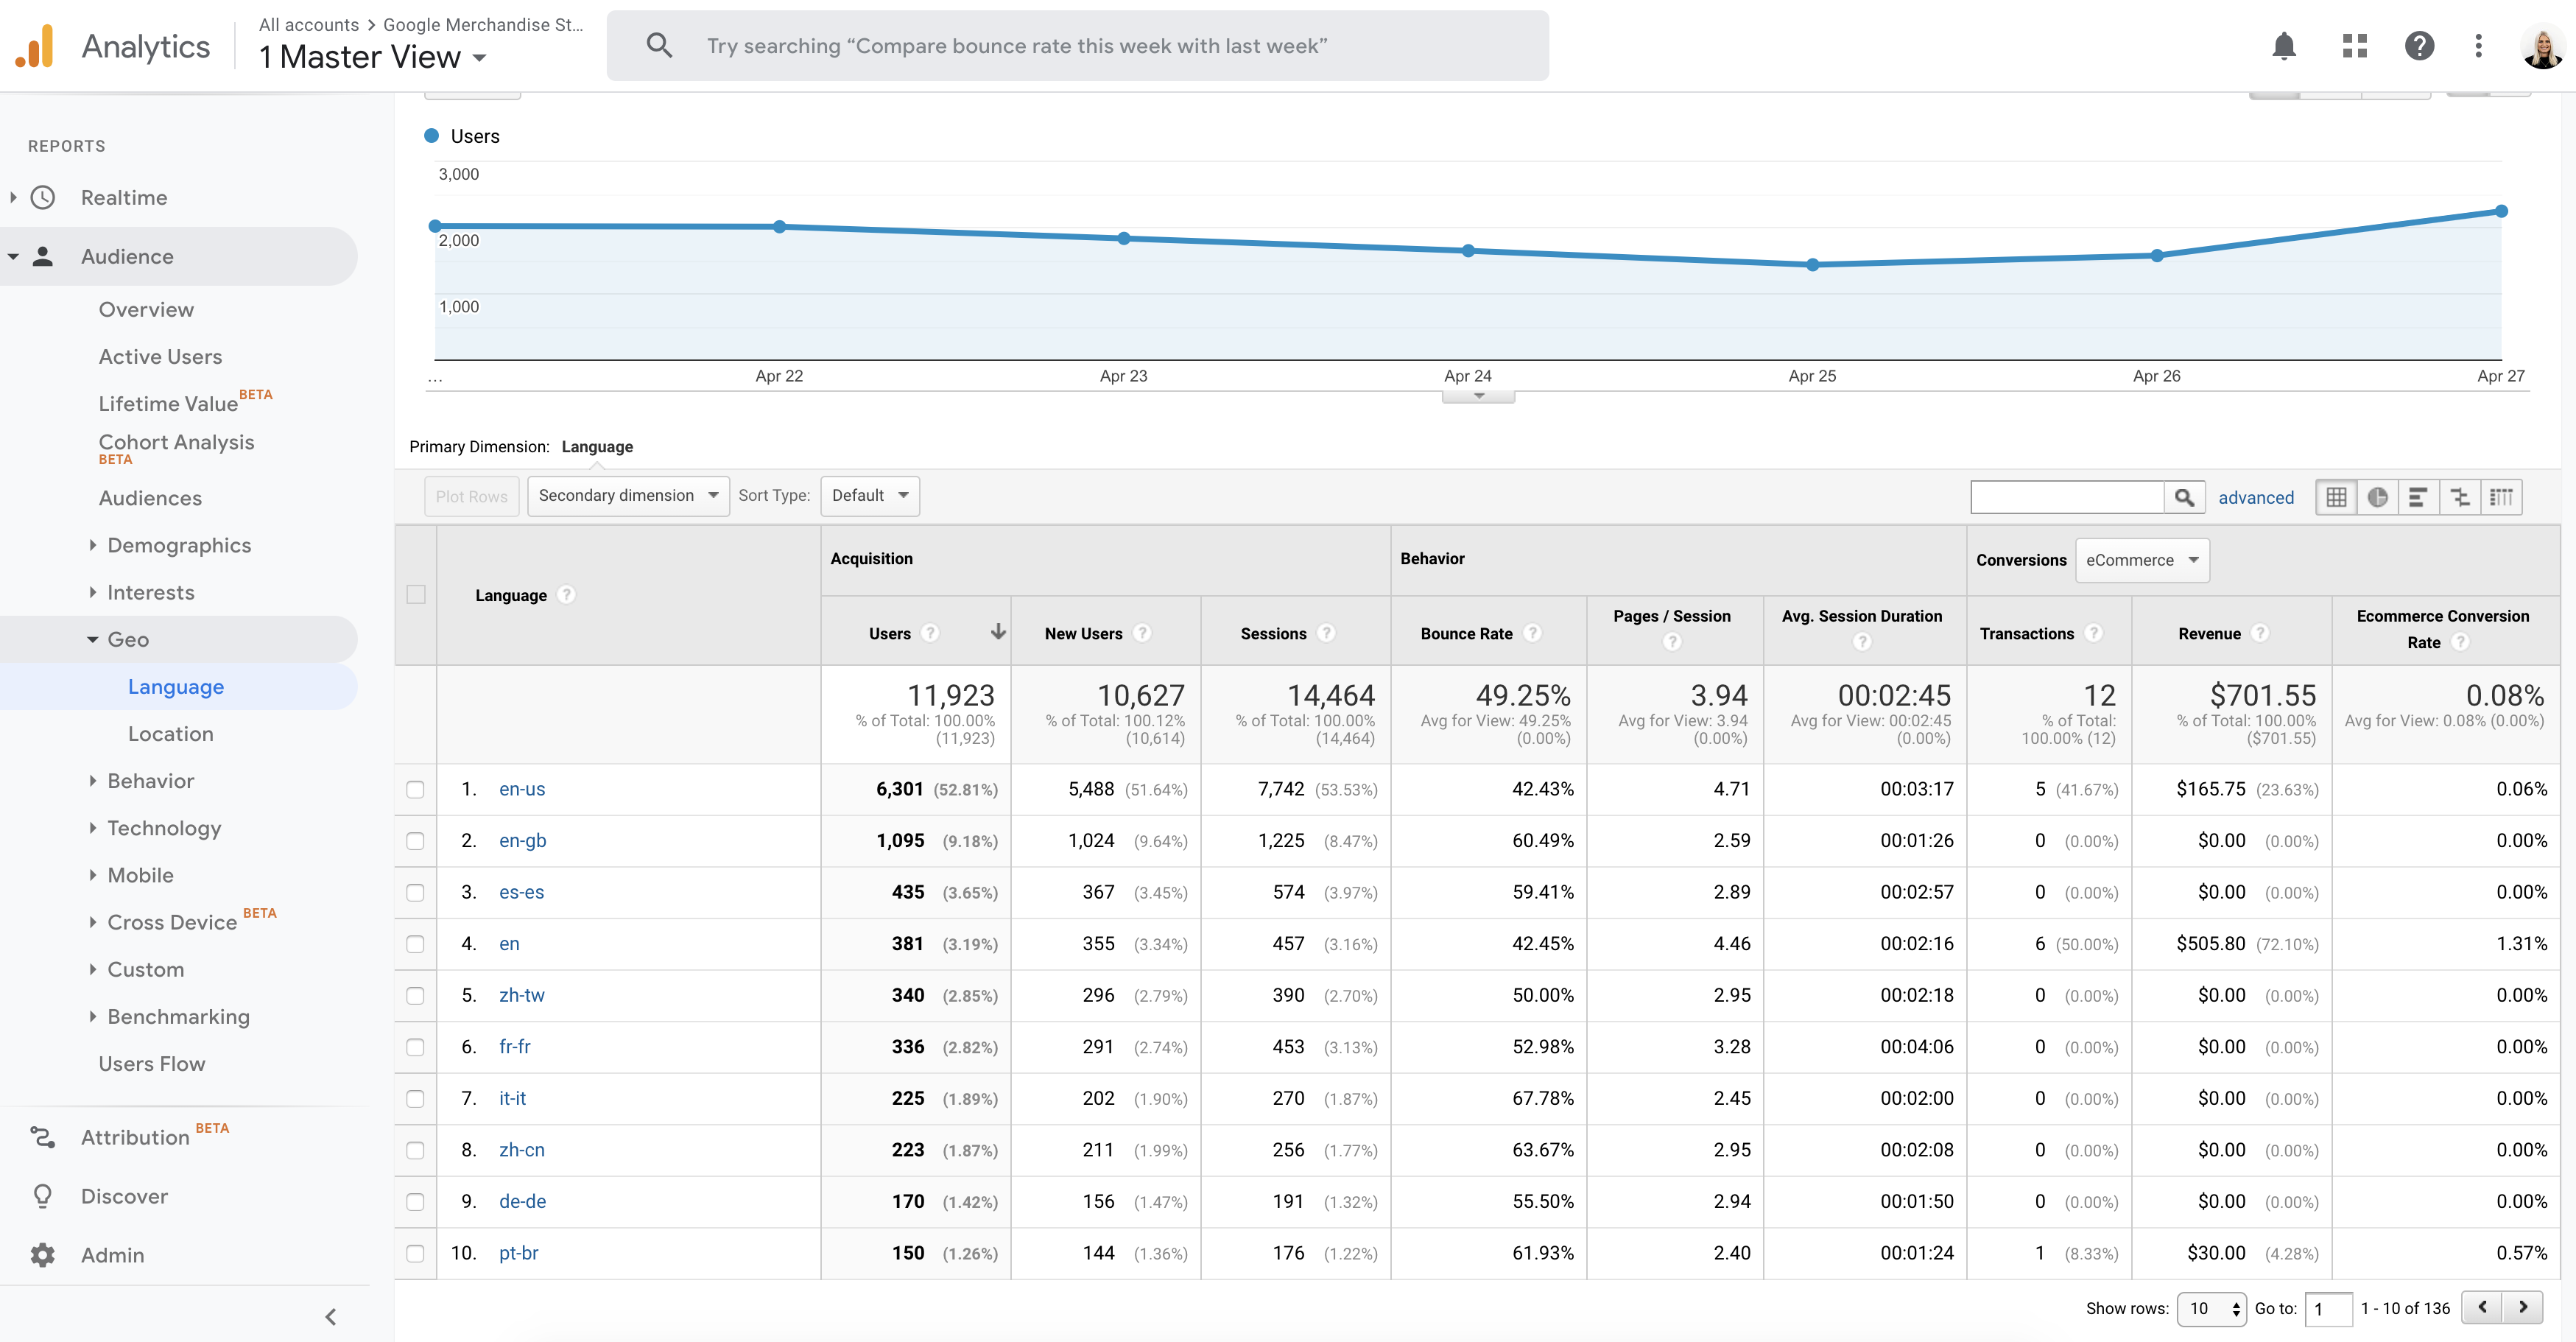
In the “Geo” tab, you can also access a detailed breakdown of the user’s country of origin, region, and language which is derived from the user’s IP address. This information is helpful as it provides you with an understanding of how many active users your website is attracting and what geographic area these users are located in. You can then tailor your content, products, and marketing to increase the user website experience for users from these locations.


Source: Google Analytics for the Google Merchandise Store
Acquisition
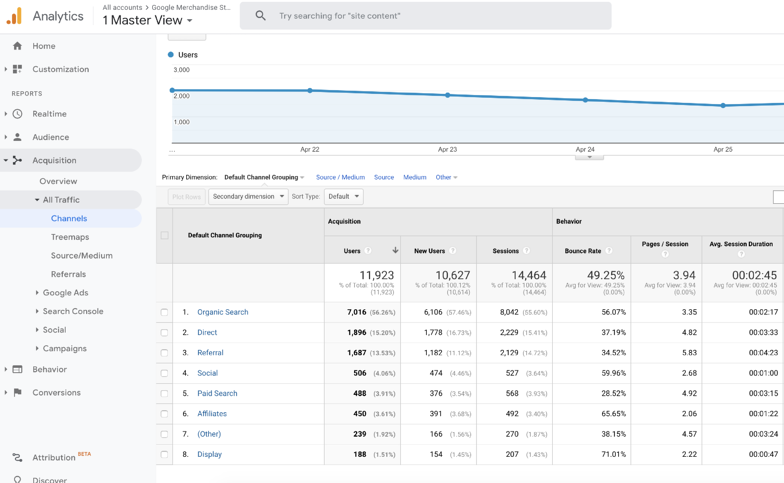
The Acquisition report gives you an all-rounded summary of how users are finding and using your website through different traffic sources. When accessing the acquisition report on the left-hand side of your account, you may notice that it is broken into six sections: Overview, All Traffic, Adwords, Search Console, Social, and Campaign. All six tabs are useful for interpreting data but we recommend frequently monitoring the “Overview” and “All Traffic” tabs of the report. The overview report displays how users reach your website, their behavior once they are on the website, and their conversion path if they complete a form, which is known as the Acquisition Behavior Conversion (ABC) cycle. The ‘All Traffic’ section of the report provides details on the source of the traffic and the channels that the prospective parent has used. These channels are broken up into:
- Organic Search
- Direct
- Social
- Referral
- Paid Search
- Other advertising
Under each channel, Google Analytics provides you with numbers for sessions, new sessions, and new users. It’s important to understand how many users come from each channel and which channel provides the most users and the highest conversion rate. If you are able to determine the channel that produces the highest traffic flow and conversions you can then invest more time, money, and content into these channels to continue driving website visits.


Source: Google Analytics for the Google Merchandise Store
If your school utilizes Google Adwords and pay per click campaigns you can also connect your account through Google Analytics. After connecting you can access a report that allows you to see users’ behavior when they click on ads as well as track campaigns and keyword performances. As a school marketer, it is helpful to see where and when users are clicking on your ads so that you can adjust them accordingly.
Behavior
The Behavior flow report provides a deep dive into the user’s activity once they are on your school website. It utilizes nodes, connections, and exits to create a flow path for the user. It breaks down the report into the categories of:
- Site Content
- Site Speed
- Site Search
- Events
- Publisher
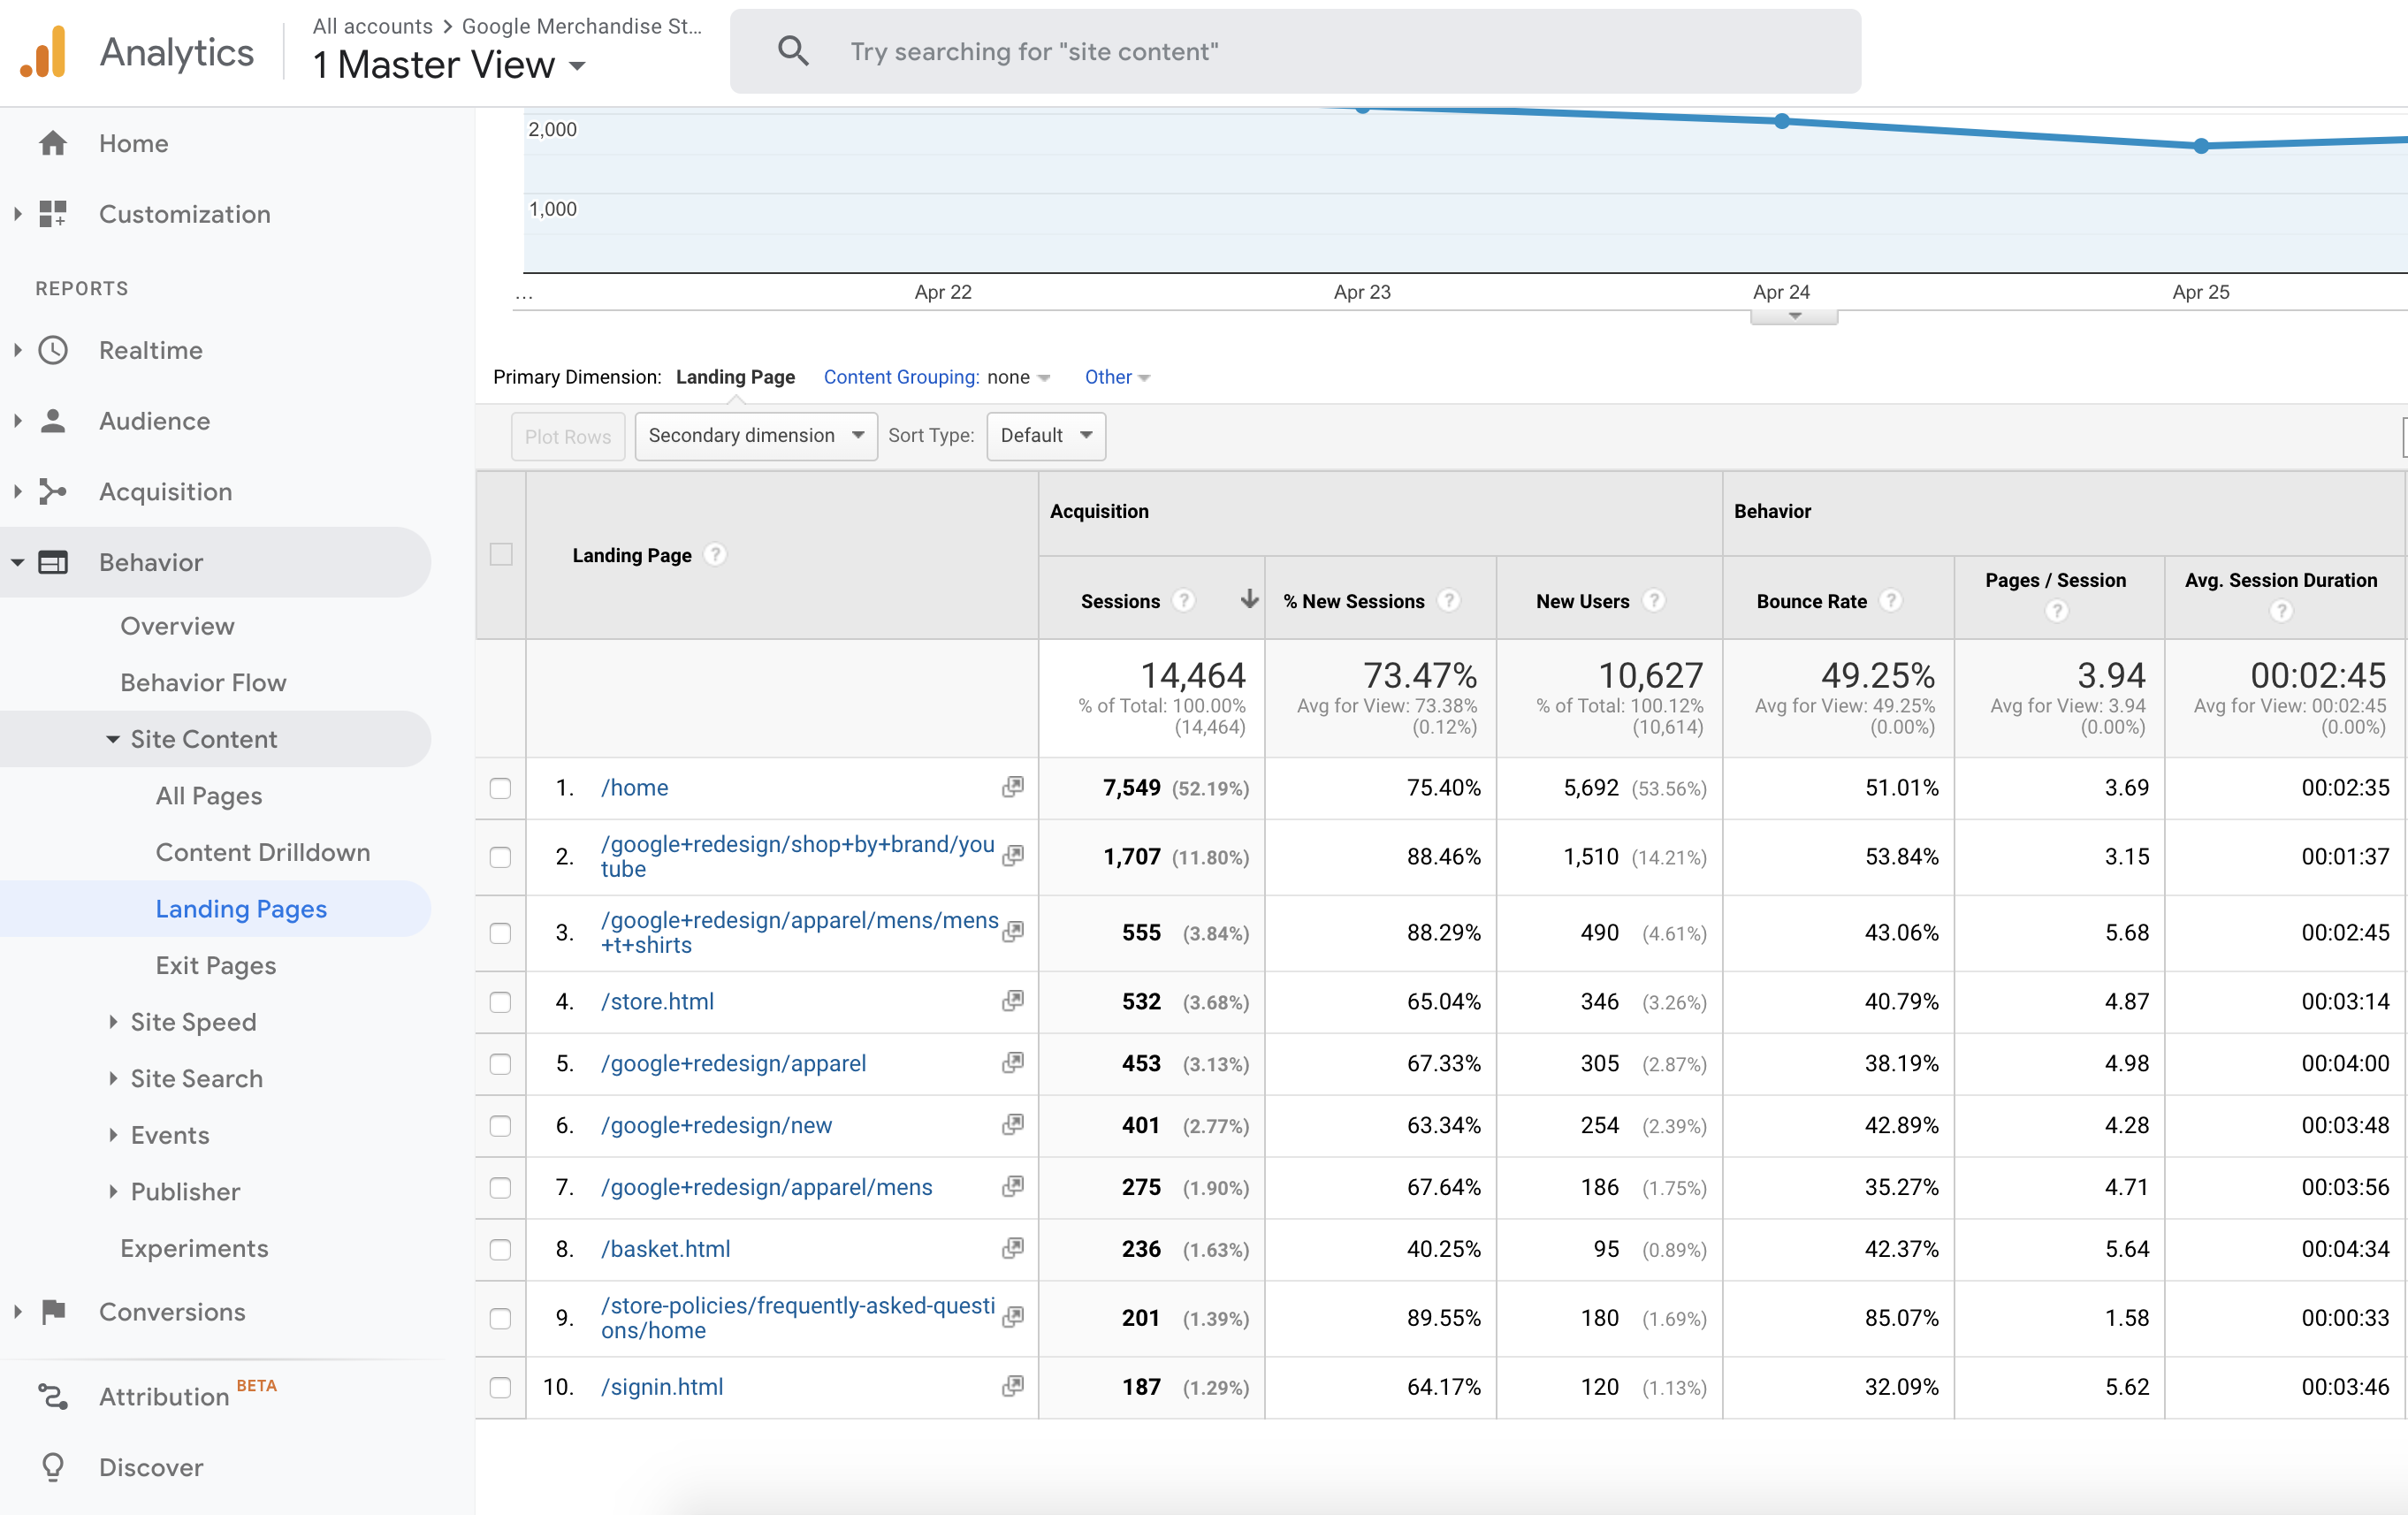
It’s a good idea to get familiar with all areas of the behavior report, however, the most important tab is the Landing Page tab under Site Content. This section of the report provides detail of individual areas of the site that users are visiting. You can also view the average duration spent on each area and the website bounce rate. With these figures, you can interpret the level of engagement that users have with your school content and what content areas may require improvement and updates. It may also help to understand if users go directly to enrollment pages or if they prefer to click through all of the website content before making a conversion decision.


Google Analytics for the Google Merchandise Store
Google Analytics has an abundance of data and although it may seem time-consuming and confusing to analyze. If you have an understanding of the basic reports you can update and improve your content to further cement your marketing strategies and increase conversions. Once you’re comfortable with Google Analytics you can begin to create your own custom graphs, charts, and KPIs that you can send to your school staff. If you would like a visual representation of Google Analytics before utilizing it for your school website you can access Google’s free demonstration that utilizes real-life data from a live Google Merchandise store.
If you’re interested in updating your school website before getting started with Google Analytics get in contact with our friendly team today.
Click here to read this article on the Digistorm website


![[PODCAST] How Story Builds YouTube Engagement](https://www.schoolhouse.agency/wp-content/uploads/2021/08/PODCAST-How-Story-Builds-YouTube-Engagement.png)


